Turkey’s Energy and Natural Resources Minister Fatih Dönmez announced that the share of domestic resources in the country’s electricity generation has risen to 60 percent by January, 2019.
Dönmez, on his Twitter account, reminded that the share of domestic resources in power generation was 45 percent in January, 2018.
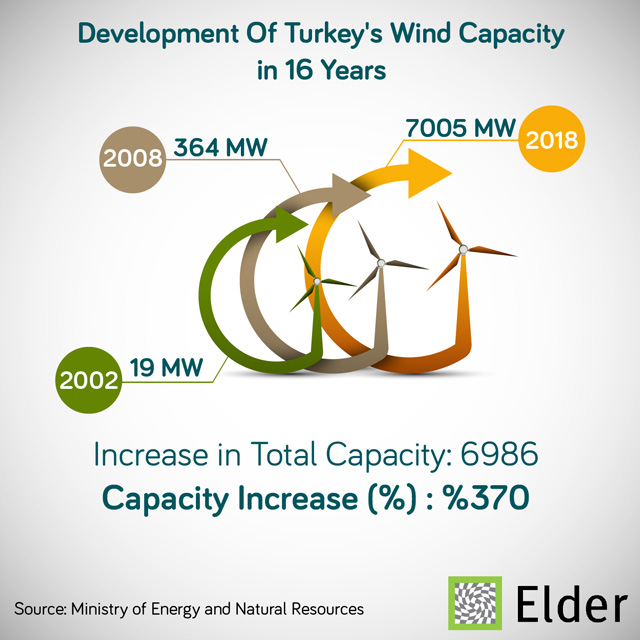
Underlining that Turkey is continuously increasing its production from domestic and renewable energy resources, Dönmez shared the latest figures on power generation.
According to the data shared by Dönmez, domestic and renewable energy resources created around 60 percent of total generation in January, 2019.
Additionally, generation from hydro made up 30 percent while wind 8,40 percent and solar 1,52 percent in the total power production last month.
Geothermal resources produced 2,96 percent, generation from waste had a share of 1,31 percent and liquid had 0,53 percent.
Natural gas plants created 20 percent of the total energy generation last month, which was 33,58 percent January, 2018.
Furthermore, the share of imported coal fell back to 19,74 percent while it was 21,82 percent in the same month of 2018.
Local coal’s share stood at 15,51 percent last year, from its 15,51 percentage level in January, 2018.
Source: Turkey's Energy and Natural Resources Minister Fatih Donmez
Turkey's electricity import bill in 2018 decreased by 33 percent compared to the previous year, according to Turkish Statistical Institute's (Turkstat) data Monday.
The data shows that Turkey paid nearly $57.03 million for electricity imports in 2018, compared to $85.50 million for 2017.
The amount of electricity imported last year reached nearly 1.38 billion kilowatt-hours (kWh), compared to 1.66 billion kWh in 2017.
Turkey bought electricity from five countries - Greece, Czechia, Bulgaria, Georgia and Azerbaijan, the data shows, out of which Bulgaria held the biggest share of electricity exports to Turkey.
Turkey bought nearly 1.01 billion kWh of electricity from Bulgaria out of a total amount of 1.38 billion kWh in 2018 paying $42.20 million to its neighbor.
Georgia followed Bulgaria with 239.95 million kWh of imports for which Turkey paid nearly $8.58 million.
Azerbaijan, Greece and Czechia followed with 73.61, 35.71 and 24.14 million kWh of electricity imports, respectively. Turkey paid $3.54 million to Azerbaijan, $1.62 million to Greece and $1.05 million to Czechia for imports last year.
Additionally, May saw the highest electricity imports in 2018 when Turkey imported 232.66 million kWh of electricity and paid $9.34 million.
Source: AA
Rail is among the most energy efficient modes of transport for freight and passengers, yet is often neglected in public debate, according to a new report by the International Energy Agency prepared in cooperation with the International Union of Railways (UIC).
The Future of Rail is the latest in the IEA series shining a light on “blind spots” in the energy system, which are issues that deserve more attention from policymakers. It was released today in New Delhi by IEA Executive Director, Dr. Fatih Birol, at an event opened by India’s Minister of Railways, Shri Piyush Goyal.
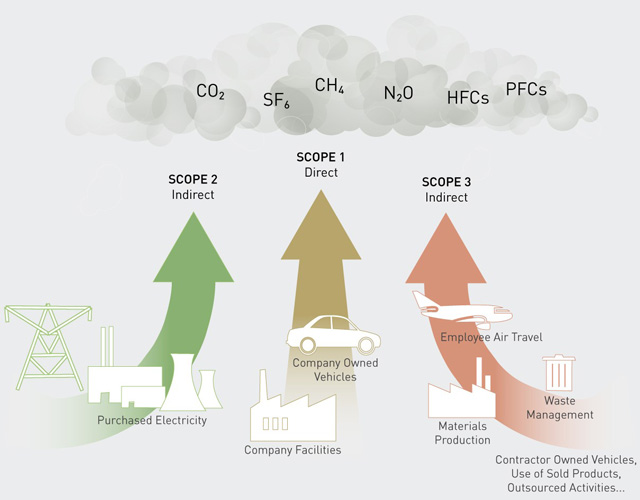
The transport sector is responsible for almost one-third of final energy demand, nearly two-thirds of oil demand and nearly one-quarter of global carbon dioxide (CO2) emissions from fuel combustion. Therefore changes in transportation are fundamental to achieving energy transitions globally. While the rail sector carries 8% of the world’s passengers and 7% of global freight transport, it represents only 2% of total transport energy demand, highlighting its efficiency.
“The rail sector can provide substantial benefits for the energy sector as well as for the environment,” said Dr. Fatih Birol. “By diversifying energy sources and providing more efficient mobility, rail can lower transport energy use and reduce carbon dioxide and local pollutant emissions.”
The Future of Rail includes a Base Scenario that projects the evolution of the railways sector to 2050 on the basis of announced policies, regulations and projects. It also includes a High Rail Scenario to demonstrate the energy and environmental benefits of a more significant shift of passengers and goods to rail transport. While the High Rail Scenario requires about 60% more investment than in the Base Scenario, global CO2 emissions from transport peak in the late 2030s, air pollution is reduced and oil demand is lowered.
The report includes a specific focus on India. “Rail serves as a vital lifeline of India, playing a unique social and economic role,” said Drç Birol. Rail remains the primary transport mode in the country, providing vital connections within and between cities and regions, and guaranteeing affordable passenger mobility that has long been a government priority. Rail passenger traffic in India has increased by almost 200% since 2000 yet prospects for future growth remain bright. Construction has started on India’s first high-speed rail line, the total length of metro lines is set to more than triple in the next few years, and two dedicated freight corridors are on track to enter operation by 2020.
In all countries, including India, the future of the rail sector will be determined by how it responds to both rising transport demand and rising pressure from competing transport modes. Rising incomes and populations in developing and emerging economies, where cities are growing exponentially, are set to lead to strong demand for more efficient, faster and cleaner transportation, but the need for speed and flexibility tend to favor car ownership and air travel. Rising incomes also drive demand growth in freight, where higher incomes, have sharply increased demand for rapid delivery of higher value and lighter goods.
Source: IEA

The United Arab Emirates likes breaking world records. Flush with oil money and blessed with plenty of open land, the country has the world’s tallest building, largest mall, largest desalinated water reservoir, and one of the largest solar farms.
It can now add one more record to the list: the world’s largest virtual battery plant.
Earlier this month, the department of energy in Abu Dhabi turned on a 108 MW/648 MWh sodium-sulfur battery plant. For comparison, the storage capacity of the Abu Dhabi battery is about five times that of the lithium-ion battery system Tesla installed in Hornsdale, Australia in 2017.
The batteries are installed in 10 different locations in Abu Dhabi, but they can be controlled as a single plant. Hence, the department of energy calls it a “virtual” battery plant.
Like other oil rich countries in the Middle East, the UAE still gets almost all of its energy from fossil fuels. But it stands out in the region by also getting big on renewables. “In 50 years, when we might have the last barrel of oil… I can tell you we will celebrate that moment,” said Sheikh Mohammed Bin Zayed, the crown prince of Abu Dhabi, a few years ago.
The country plans to spend $160 billion by 2030 on renewable energy, setting a 2050 goal to get more than 60 percent of its electricity from carbon-free sources. That’s not as bold as the net-zero emissions goal adopted by others around the world, but it’s among the most ambitious in the Middle East.
The move is driven by the necessity. Emiratis mostly live on the coasts and will face insurmountable challenges as climate change causes sea levels to rise.
Source: QZ
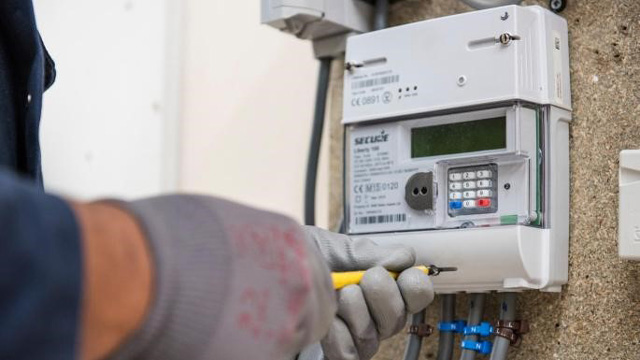
US utility giant Pacific Power is rolling out 24 000 smart meters in Clatsop County, as part of a $117 million investment in an overall rollout of 590 00 smart meters across Oregon.
Installations are expected to be completed by early May, 2019.
The smart meters communicate power usage data using a wireless mesh network to the utility’s servers. Within six weeks of installation, consumers will be able to track and monitor their energy usage via a secure portal.
“From other customers with smart meters, they have better insight into their energy use,” said Alisa Dunlap, a regional business manager with Pacific Power in northwest Oregon. “They can take a look when things are spiking, which internal issue might be occurring.
“Right now, customers have to call us when the power is out,” she said. “These meters will automatically notify us, so outages should be shorter.”
Cory Estlund, Pacific Power’s manager of field support, reported a total of approximately 70 million smart meters across the U.S. More than two-thirds of Oregon homes and businesses have upgraded to smart metering, following the utility’s decision to wait for more refined technologies, and more competitive pricing before investing.
“The difference is they have a communication module that lets us handle data,” Estlund said. “Now we can do things remotely without having to roll out a truck and look at a meter.”
Although the change to online meter-reading will result in 100 positions being made redundant from Pacific Power’s statewide workforce of 5,500, the utility has taken an active role in helping affected workers find new roles internally or other employment as part of a two year-long transformation process, according to Dunlap.
The utility has engaged in customer communication programmes regarding the rollout. Workers for meter manufacturer Aclara will visit customers with badges identifying them as installers. Installation will be free of charge.
Customers have the option to opt out of having the smart meters installed, but will have to pay a $36 monthly fee for meter reads.
The utility's interest in the state includes piloting EV services after gaining approval from the Oregon Public Utility Commission early in 2018.
Source: Smart Energy
By now we’re used to stats that show what would happen if everyone in the world had the same carbon footprint as a European, or an American, someone in China, or indeed anywhere. According to the consultancy right based on science, they have now created a way of modelling the same projections, except for specific companies. The model also number-crunches a company’s climate strategy to work out whether they are going to help or hinder the race to cut emissions. Hannah Helmke and Roman Herzog of right based on science explain how it works and how it should be used to make companies realistic about their ambitions.
As climate change gains financial relevance, companies from all sectors are proudly claiming to have the best methods and strategies in place to reduce their carbon footprint. This sounds uplifting at a first glance, but when we dive deep into their strategies there seems to be a missing link between the strategies companies claim to be enacting and the real environmental benefits they actually deliver.
“Regarding Climate Change: Enel is one step ahead” claims Enel S.p.A., the Italian utility company. However, the earth would warm up to 6.08°C (using the Standard XDC 2016 model) by 2050 if every company performed as Enel S.p.A does. So, what does this mean? This means that a necessary link, based on scientific findings, needs to be established and acted upon if companies are in fact serious about complying with the 2°C target agreed upon by the global community, under the Paris Climate Agreement.
How can companies measure if their strategies can hit the 1.5°C/2°C target?
Our X-Degree Compatibility (XDC) Model calculates a company’s climate impact based on scientific input by the Intergovernmental Panel on Climate Change (IPCC) and other accredited institutions, and models that specific company´s financial performance, in order to calculate how much global warming would take place if all companies operated as emission intensively as the company in question. As previously mentioned, ENEL S.p.A, would contribute to global temperatures increasing to 6.08°C by 2050. Very far off the 2°C target.
So, what can companies do? They can start by calculating their XDC and determining if their strategy is green enough. In order to do this we at right based on science, an information and consulting company, with the support of the Department of Energy of the City of Frankfurt and the European Union, have developed the XDC web application (XDC webApp).
The XDC webApp reduces the complexity of calculating your standard XDC to a minimum. With a few clicks companies will be able to figure out where they stand. You can try it out for yourself. After having calculated their XDC, they can first assess their performance against their sector, which is also provided when using the XDC webApp and depending on the results, choose a strategy that at least brings them close to that target.
To take an example from the chemicals sector, we find a wide range of variance between companies’ XDC (using the Standard XDC 2016 model): Givaudan SA, with an XDC of 2.06°C ranks much better than LANXESS AG with and XDC of 6.54°C. In order to make this comparison valid, we pay attention to the company´s size, financial and environmental performance, and then compare the results to its targets, to determine how realistic the company´s strategy is for providing an effective response to global warming.
What do you need to calculate your XDC?
Normally, the Model’s variable input parameters are easily available. They consist of a company’s (i) emissions and (ii) gross value added (GVA). We obtain a company’s emission data and that from its respective sector from a list of outstanding data suppliers. As a user of the XDC Model, you can choose which data base you want the XDC to be calculated upon. We obtain country emission data exclusively from public sources. Through the European Space Agency Business Incubation Centre Darmstadt (ESA BIC), we also have access to satellite data, which we will use in the future for country specific XDC calculations. Information on a company’s and sector’s GVA we obtain from FactSet Research Systems.
In principle the XDC is available in two different forms: The Standard XDC and the Scenario Based XDC. The Standard XDC, with sector-specific default parameters allows you to compare your company to others within the sector. The Standard XDC is calculated under the assumption of global GVA increasing by 3.2 % on an annual basis until 2050 (taken from the IMF’s World Economic Outlook figures). The company’s growth is mapped along sector-specific lines according to these accredited sources. The relationship between emissions and GVA remains fixed in a business-as-usual scenario until 2050.
Source: Energy Post
Managing Cyber Risk In The Electric Power Sector
The power sector is one of the most frequently targeted and first to respond to cyber threats with mandatory controls. But threats continue to evolve, reaching into industrial control systems and supply chains, and requiring even greater efforts to manage risk.
Please click here to read the full report.