Switching reached new record levels. In October there were 534,746 electricity switches and 461,000 gas switches. These were respectively the highest level of electricity switching ever recorded in the same month and the highest ever level of gas switching in any month. The number of switches to small and medium suppliers also increased compared to September, by around 13% in electricity and 17% in gas. See Switching and consumer experience.
Electricity At-a-glance summary
Between 2004 and Q2 2017, the electricity market share of the large six suppliers dropped from nearly 100% to 82%.
The combined market share for five of the large electricity suppliers (excluding British Gas) in the GB domestic market declined by 15 percentage points, from 75% to 60%. Individual market shares fluctuated between 10% and 22%.
In the same period, British Gas was the leading domestic electricity supplier in GB, with a market share ranging between 22% and 25%.

Until 2012, other suppliers held a market share of below 2%. Since then, their share has grown significantly. They reached a market share of 18% in Q2 2017, four percentage points up on Q2 2016. Five of these (Utility Warehouse, OVO, First Utility, Utilita, and Cooperative Energy) increased their individual market shares above 1%, with First Utility reaching over 3%. These medium sized suppliers had slower growth in the year to Q2 2017, compared to previous years in the 2012-2015 period. On the other hand, small suppliers, who have individual market shares below 1%, have reached a combined market share of 8% in Q2 2017, 3 percentage points up compared to Q2 2016.
Gas Market At-a-glance summary
Between 2005 and Q2 2017, the gas market share of the large six suppliers dropped from nearly 100% to 81%.
The combined market share for the largest gas supplier in the GB domestic market, British Gas, declined by 22 percentage points to 33%. Nonetheless, this remains significantly higher than the next largest competitor, SSE, which held an 11% market share in June 2017.
In the same period, the individual market shares of the remaining four large suppliers fluctuated between 5% and 13%.
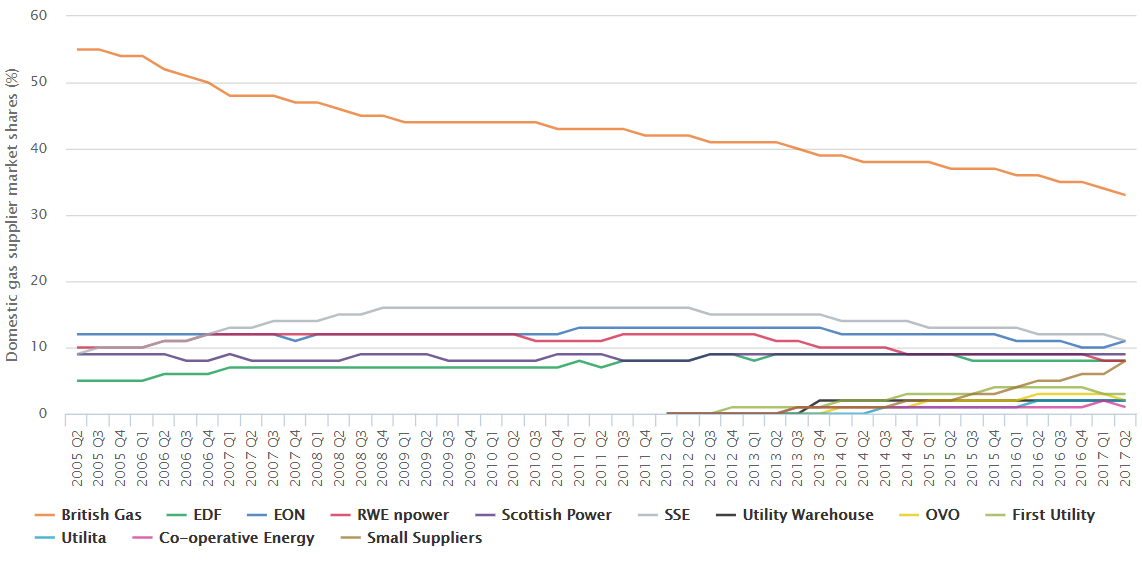
Until 2012, all other suppliers held a market share of below 2%. Since then, their share has grown significantly. They reached a combined market share of 19% in Q2 2017, four percentage points up on Q2 2016. Five of these (Utility Warehouse, OVO, First Utility, Utilita and Cooperative Energy) increased their individual market shares above 1%. However, these medium sized suppliers had slower growth in the year to Q2 2017 compared to previous years in the 2012-2015 period. Small suppliers, who have individual market shares below 1%, reached a combined market share of 8% in Q2 2017, three percentage points up on Q2 2016.
Switching
Consumers promote effective competition by being actively engaged in managing their energy, and making a credible threat of switching where better offers are available. This pressures suppliers to innovate and offer better products and services for them.

We look at trends in external switching (between suppliers) and internal switching (with the same supplier) to understand levels of consumer engagement. We also look at average switching times, an indicator of process quality, and consider trends in overall consumer satisfaction with suppliers. These indicators are a snapshot of our more detailed consumer research on market engagement.
Between January 2014 and June 2017, the average switching time for gas fell by 9 days to 15 days. There was a slight peak in late 2015 and early 2016. This follows changes to gas industry rules in November 2013.
The average switching time for electricity has been relatively steady since the end of 2014 at around 16 days.
Prices and Profits
At-a-glance summary
Competition in the energy market is necessary to incentivize suppliers to improve their cost efficiency. It should also push suppliers to improve their prices and services in the fear that if they do not, they will lose customers to their rivals and will struggle to attract new business.

From the start of 2014 until early 2016, the price difference between the average standard variable tariff and the cheapest tariff available in the market increased significantly. This is because the price of the cheapest tariffs fell at a much faster rate than that of the average standard variable tariff. The differential peaked in February 2016 at £350. Since then, and up to January 2017, the average SVT has continued to drop and the cheapest tariff in the market has increased, driven primarily by increases in wholesale prices.
Our indicators show trends across available tariff types and contracts, and the prices suppliers offer to different customer groups. Energy company profits help us to understand the strength of competition among companies. We assess this through the companies’ pre-tax margins, out of which they make a profit. We also look at the costs that make up a typical dual fuel customer bill over time to better understand what factors drive price changes.
Between February 2017 and November 2017, the cheapest tariff in the market has fluctuated, but returned to roughly the same level. Over the same period the cheapest tariff offered by the six large suppliers has remained roughly the same.
The average price of SVTs offered by the six large suppliers increased from February to November 2017, reaching £1,135. These SVT increases were the first for most of these suppliers since the end of 2013. The differential between the average price of the SVT offered by the six large suppliers and the cheapest tariff has generally shown an increasing trend since February 2017, but was stable relative to the previous month at £308 in November.
The differential between the basket of cheapest tariffs and the average standard variable tariff for the six large suppliers stood at £288 in November 2017, an increase of 3% over the previous month.
Source: OFGEM